gradle에서 JMH 사용해보기, async profiler로 flamegraph 출력하기
작성일: 2023-07-06 23:35
# JMH 사용
# gradle 플러그인 추가
plugins {
  id "me.champeau.jmh" version "0.7.1"
}
1
2
3
2
3
- 별다른 의존성 추가없이
build.gradle에 JMH 플러그인(github (opens new window))만 추가하면 된다.
# 벤치마크 클래스 위치
src/jmh
     |- java       : java sources for benchmarks
     |- resources  : resources for benchmarks
1
2
3
2
3
- 벤치마크 클래스는
src/main/java가 아닌src/jmh/java에 작성해야 한다. - 플러그인이
src/jmh/java내부의 클래스들이src/main/java에 정의된 클래스를 의존할 수 있게 자동으로 구성해준다. - JMH 옵션에서
includeTests=true로 설정하면 테스트코드도 의존할 수 있게 설정가능하다.
# JMH 옵션 설정하기
jmh {
    iterations = 3
    warmupIterations = 3
    fork = 1
}
1
2
3
4
5
2
3
4
5
build.gradle에서 jmh 블럭에서 설정할 수 있다.- 모든 옵션은 JMH 플러그인 github (opens new window)에 자세히 나와있다.
# 벤치마크할 함수 작성
// src/main/java
import java.util.stream.IntStream;

public class Sum {
    public static int forSum(int maxNum) {
        int sum = 0;
        for (int i = 1; i <= maxNum; i++) {
            sum += i;
        }
        return sum;
    }

    public static int streamSum(int maxNum) {
        return IntStream.rangeClosed(0, maxNum).sum();
    }
}
1
2
3
4
5
6
7
8
9
10
11
12
13
14
15
16
2
3
4
5
6
7
8
9
10
11
12
13
14
15
16
- 1부터
maxNum까지의 숫자를 모두 더하는 함수를 for문과 stream을 이용해서 작성해보고 이 둘의 성능을 비교해보자.
# 벤치마크 클래스 작성
// src/jmh/java
import org.openjdk.jmh.annotations.Benchmark;
import org.openjdk.jmh.annotations.Scope;
import org.openjdk.jmh.annotations.State;
import org.openjdk.jmh.infra.Blackhole;

@State(Scope.Benchmark)
public class SumBenchmark {
    @Benchmark
    public void forSum(Blackhole bh) {
        bh.consume(Sum.forSum(1000));
    }

    @Benchmark
    public void streamSum(Blackhole bh) {
        bh.consume(Sum.streamSum(1000));
    }
}
1
2
3
4
5
6
7
8
9
10
11
12
13
14
15
16
17
18
2
3
4
5
6
7
8
9
10
11
12
13
14
15
16
17
18
- 기본적인 사용법은 클래스에
@State로 scope를 지정하고 벤치마크할 메서드에@Benchmark를 붙이면 된다. - JMH Sample (opens new window) 에서 다양한 JMH Annotation들의 사용법을 살펴볼 수 있다.
bh.consume에 함수의 결과를 넘기는 이유는 JVM이 의도치않게 최적화 하는것을 방지하기 위함이다.
# 실행
./gradlew jmh
1
jmhgradle 태스크를 실행하면/src/jmh/java내의 벤치마크 클래스들의 벤치마크가 수행된다.- JMH Options에서
includes를 사용하면 원하는 벤치마크 클래스를 설정할 수 있다.
# 결과
Benchmark                Mode  Cnt        Score        Error  Units
SumBenchmark.forSum     thrpt    3  4114130.377 ± 111486.127  ops/s
SumBenchmark.streamSum  thrpt    3  3348063.640 ± 236175.095  ops/s

Benchmark result is saved to /Users/dongmyeonglee/Projects/temp/jmh_blog/build/results/jmh/results.txt

BUILD SUCCESSFUL in 2m 2s
6 actionable tasks: 6 executed
1
2
3
4
5
6
7
8
2
3
4
5
6
7
8
- 결과를 보면
forSum함수의 스코어가 더 높은 것을 확인할 수 있다. - 단위가
ops/s이므로 초당 연산 수가forSum이 더 높은 것이다. 즉forSum의 성능이 더 뛰어나다.
# async profiler로 flame graph 출력하기
해당 벤치마크할 함수들을 flame graph로 출력하면 호출 스택과 각 호출에 소요된 시간을 한눈에 파악할 수 있다. 왜 forStream이 더 느린지 flame graph로 파악해보자.
# 라이브러리 다운
- async-profiler git (opens new window)에서 자신의 OS에 맞는 async-profiler를 다운로드하고 압축을 해제한다.
# JMH 옵션 설정하기
jmh {
    iterations = 3
    warmupIterations = 3
    fork = 1
    profilers = ['async:libPath=/Users/Utils/async-profiler-2.9-macos/build/libasyncProfiler.so;output=flamegraph;dir=async-profiler-results']
}
1
2
3
4
5
6
2
3
4
5
6
profilers옵션에서 사용하고자 하는 프로파일러를 지정할 수 있다.- async-profiler를 사용하므로
async:를 시작으로 필요한 async-profiler 옵션을 붙이면된다. libPath에 다운로드한 async-profiler의 파일 위치를 입력하면 된다. MacOS기준으로build/libasyncProfiler.so를 사용하면된다.flamegraph로 출력하기 위해 output 옵션을 붙이고async-profiler-results폴더에 결과를 저장하도록 설정했다.- JMH에서 async-profiler에 설정할 수 있는 옵션목록을 보는게 까다로워서 따로 첨부한다.
- 코드레벨에서 확인도 가능하다: AsyncProfiler.java (opens new window)
async-profiler options(클릭)
Usage: -prof <profiler-name>:opt1=value1,value2;opt2=value3

Options accepted by async:

output=<format+>                 Output format(s). Supported: [text, collapsed,
flamegraph, tree, jfr]. (default: [text])

direction=<direction>            Direction(s) of flame graph. Supported: [forward,
reverse, both]. (default: [both])

libPath=<path>                   Location of asyncProfiler library. If not specified,
System.loadLibrary will be used and the library
must be made available to the forked JVM in an entry
of -Djava.library.path, LD_LIBRARY_PATH (Linux),
or DYLD_LIBRARY_PATH (Mac OS).

event=<event>                    Event to sample: cpu, alloc, lock, wall, itimer;
com.foo.Bar.methodName; any event from `perf list`
e.g. cache-misses (default: [cpu])

alloc=[sample bytes]             Enable allocation profiling. Optional argument
(e.g. =512k) reduces sampling from the default of
one-sample-per-TLAB. May be captured as a secondary
event under output=jfr.

lock=[duration]                  Enable lock profiling. Optional argument (e.g.
=1ms) limits capture based on lock duration. May
be captured as a secondary event under output=jfr.

dir=<dir>                        Output directory.

interval=<ns>                    Profiling interval.

jstackdepth=<frames>             Maximum Java stack depth.

framebuf=<bytes>                 Size of profiler framebuffer.

filter=<boolean>                 Enable thread filtering during collection. Useful
for wall clock profiling, but only if the workload
registers the relevant threads programatically
via `AsyncProfiler.JavaApi.getInstance().filterThread(thread,
enabled)`. (default: [false])

threads=<bool>                   Profile threads separately.

simple=<bool>                    Simple class names instead of FQN.

sig=<bool>                       Print method signatures.

ann=<bool>                       Annotate Java method names.

include=<regexp+>                Output only stack traces containing the specified
pattern.

exclude=<regexp+>                Exclude stack traces with the specified pattern.

rawCommand=<command>             Command to pass directly to async-profiler. Use
to access new features of JMH profiler that are not
yet supported in this option parser.

title=<string>                   SVG title.

width=<pixels>                   SVG width.

minwidth=<pixels>                Skip frames smaller than px

allkernel=<bool>                 Only include kernel-mode events.

alluser=<bool>                   Only include user-mode events.

cstack=<mode>                    How to traverse C stack: Supported: [fp, lbr, no].

verbose=<bool>                   Output the sequence of commands. (default: [false])

traces=<int>                     Number of top traces to include in the default output.
(default: [200])

flat=<int>                       Number of top flat profiles to include in the default
output. (default: [200])

help                             Display help.
1
2
3
4
5
6
7
8
9
10
11
12
13
14
15
16
17
18
19
20
21
22
23
24
25
26
27
28
29
30
31
32
33
34
35
36
37
38
39
40
41
42
43
44
45
46
47
48
49
50
51
52
53
54
55
56
57
58
59
60
61
62
63
64
65
66
67
68
69
70
71
72
73
74
75
76
77
78
79
80
81
2
3
4
5
6
7
8
9
10
11
12
13
14
15
16
17
18
19
20
21
22
23
24
25
26
27
28
29
30
31
32
33
34
35
36
37
38
39
40
41
42
43
44
45
46
47
48
49
50
51
52
53
54
55
56
57
58
59
60
61
62
63
64
65
66
67
68
69
70
71
72
73
74
75
76
77
78
79
80
81
# 실행
./gradlew jmh
1
- 실행 방법은 jmh 벤치마크를 돌리면 된다.
# 결과
Benchmark                       Mode  Cnt        Score        Error  Units
SumBenchmark.forSum            thrpt    3  4101825.711 ± 194568.428  ops/s
SumBenchmark.forSum:·async     thrpt               NaN                 ---
SumBenchmark.streamSum         thrpt    3  3326454.191 ± 271385.971  ops/s
SumBenchmark.streamSum:·async  thrpt               NaN                 ---

Benchmark result is saved to /Users/dongmyeonglee/Projects/temp/jmh_blog/build/results/jmh/results.txt

BUILD SUCCESSFUL in 2m 3s
7 actionable tasks: 7 executed
1
2
3
4
5
6
7
8
9
10
2
3
4
5
6
7
8
9
10
- 이전과 다르게
SumBenchmark.forSum:·async,SumBenchmark.streamSum:·async가 추가된 것을 확인할 수 있다. async-profiler-results폴더를 확인해보면 각 벤치마크별 flame graph html 파일이 존재하고 해당 html 파일을 열면 flame graph를 볼 수 있다.
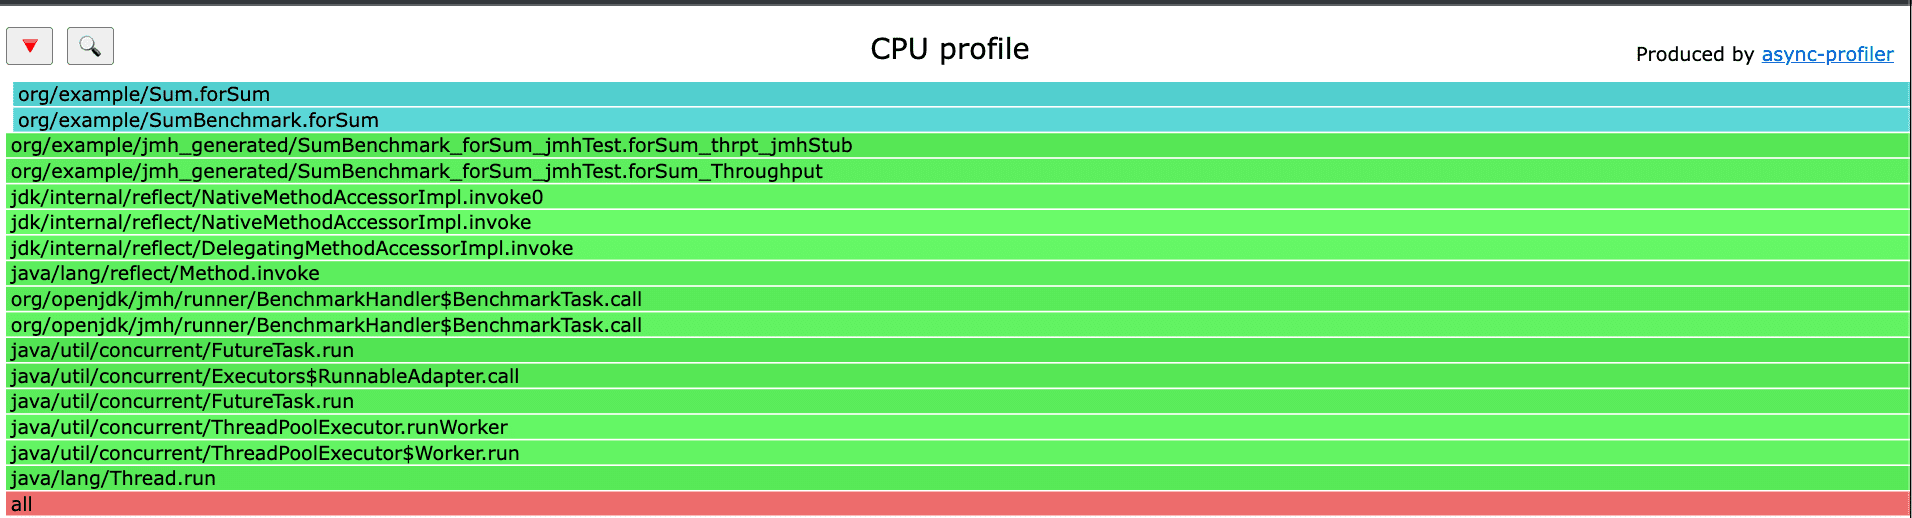
forSum_flamegraph:
streamSum_flamegraph:
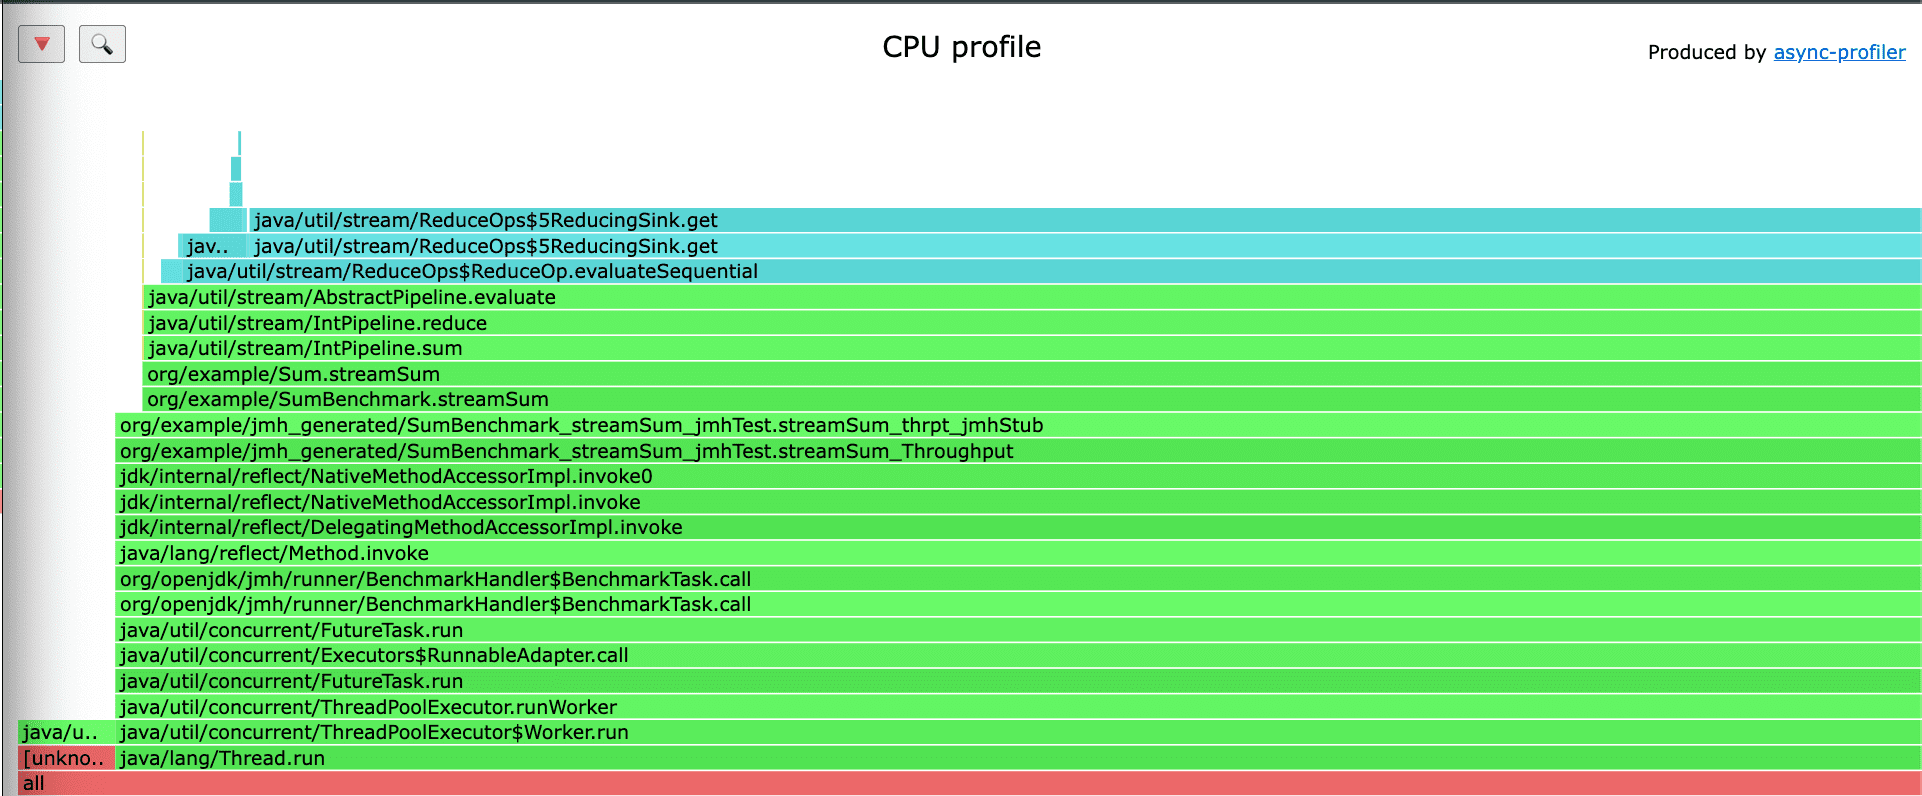
- flame graph를 보면
forSum보다streamSum에서 추가적인 함수 호출이 존재하는 것을 확인할 수 있다. streamSum의 추가적인 함수 호출로 인해 스코어가 더 낮은 것이라고 예측이 가능하다.- 조금 더 복잡한 로직을 벤치마크 돌릴 떄 flame graph를 활용하면 병목 지점을 찾는데 유용하게 사용할 수 있을 것이다.